Chart Intervals
Chart intervals are derived from the three available data-sets:
- Days >> Daily to Annual
- Hours >> 1 to 6 Hours
- Minutes >> 1 to 30 Minutes
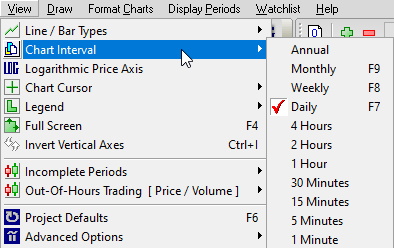
To change the chart interval in a project, use View >> Chart Interval on the main menu.

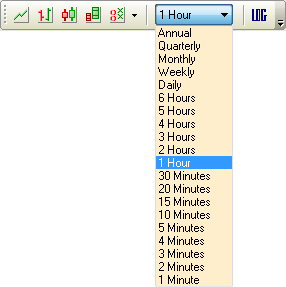
Alternatively, you can use the drop-down menu on the toolbar:

Setting Indicators
Indicators created for one data-set (e.g. Hours) will not display when you select a Chart Interval derived from another data-set (e.g. Minutes). They will, however, display across Chart Intervals derived from the same data-set (e.g. 2 to 6 Hours).
This requires you to set up 3 sets of indicators, but does allow you the flexibility of viewing the same indicator (e.g. 24-Hour Twiggs Momentum) across different Chart Intervals (e.g. 1 to 6 Hours).
Charts are integrated by data-set: you can set indicators (e.g. Moving Averages or Bollinger Bands) on a daily chart and they will appear on weekly to annual charts. You can also set daily indicators on monthly charts and vice versa. Indicator settings do not automatically change as you move between intervals in a data-set.
Creating Separate Indicator Views
You can set up separate indicators for Daily, Weekly and Monthly chart intervals using projects:
- Use File >> New Project to create separate project files for Daily, Weekly and Monthly.
- Open the Daily project to:
- Change your chart interval to daily and save in the Project Defaults.
- Add indicators, adjusting the settings to your Daily requirements.
- Open the Weekly file, change your chart interval to weekly, and set up Weekly Indicators.
- Open the Monthly file, change your chart interval, and set up Monthly indicators.
Changing Projects
To change projects, use File >> Open Project or use the recent project tabs below the chart.
For more information on projects, see Projects Explained.
Next: Projects Explained
