Accumulation Distribution Indicator
Accumulation Distribution tracks the relationship between price and volume and acts as a leading indicator of price movements. It provides a measure of the commitment of bulls and bears to the market and is used to detect divergences between volume and price action - signs that a trend is weakening.
Accumulation Distribution is an enhancement of the On Balance Volume indicator. It first compares opening and closing prices to the trading range for the period, the result is then used to weight the volume traded.
Accumulation Distribution Trading Signals
The strongest signals on the Accumulation Distribution are divergences:
- Go long when there is a bullish divergence.
- Go short when there is a bearish divergence.
Stop-losses should be placed below the most recent low (when going long) and above the latest high (when going short).
Example
Microsoft is plotted with Accumulation Distribution. Divergences are shown by trendlines.
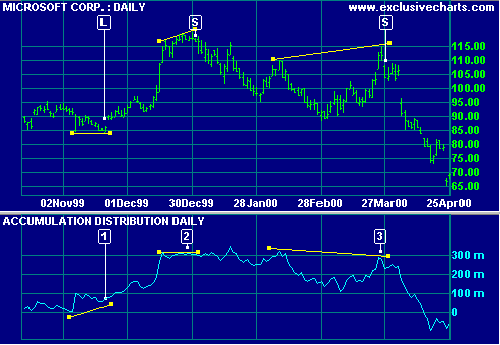
Mouse over chart captions to display trading signals.
- Go long [L]. The bullish divergence correctly predicted the subsequent rally.
- Go short [S]. The bearish divergence signaled the correction in January.
- Go short [S]. The bearish divergence signaled the correction in April.
Setup
Indicator Panel provides directions on how to set up an indicator. Edit Indicator Settings to change the default settings.
Accumulation Distribution Formula
The Accumulation Distribution Index is calculated as follows:
- Closing Price is compared to Opening Price:
Close - Open
- And compared to the day's range:
(Close - Open) / (High - Low)
- The result is multiplied by Volume for the day:
(Close - Open) / (High - Low) * Volume
- The Accumulation Distribution Index is calculated as a cumulative total of each day's reading.
EQS Formula
Some charting software use a simpler formula where the Open price is not available:
{(Close - Low) - (High - Close)} / (High - Low) * Volume
The Close is compared to the day's range rather than to the Opening Price.