Stock Screener: Twiggs® Momentum
Twiggs Momentum is particularly useful in identifying well-established trends. In this screen I use 50-Week Twiggs Momentum to identify long-term trends with the potential to last several years.
Signals are taken when 50-Week Twiggs Momentum rises above 50% or when Momentum forms a trough above the 50% line. In the example below, ASX stock REA Group (REA) signals commencement of a strong trend at the two green arrows.
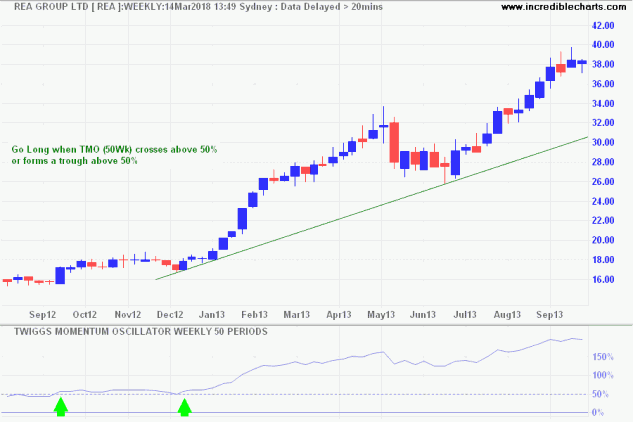
- Twiggs Momentum rises above 50%, signaling the start of the trend.
- A second entry point is signaled when Twiggs Momentum forms a trough above 50%.
Screening for Twiggs® Momentum
I created a stock screen to help identify trending stocks above 50% on 250-Day Twiggs Momentum.
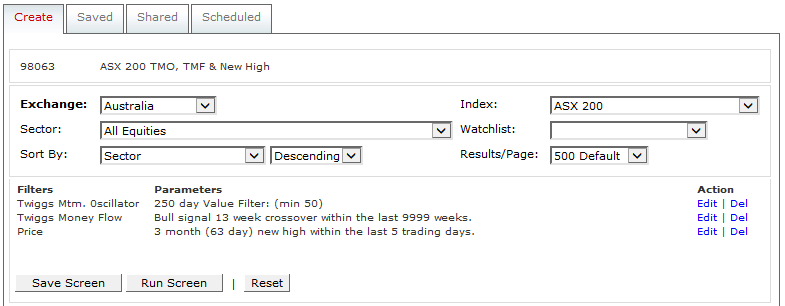
The scan combines three filters for the ASX 200:
- 250-Day Twiggs Momentum above 50%;
- 13-Week Twiggs Money Flow above zero; and
- A 63-Day New High formed in the last 5 trading days.
The idea is to capture stocks with strong momentum that also signal buying pressure (Twiggs Money Flow above zero) and have recently commenced a new rally, forming a medium-term New High.
Try the scan and let me know whether you find it useful.
The scan is available as Shared Screen #98063:
- Select
 on the toolbar
 - Select the Shared tab
- Search for ScreenID 98063
Select View if you want to amend the Exchange or Index (e.g. to US Stocks and S&P 500).